|
|
|
|
BK Investment Grade 8
Quarterly Report | 30th June 2026
|
|
The final NAV and distribution of the BK Investment Grade 8 (USD / EURO) as of 30 June 2026 are:
|
| USD Class |
|
EURO Class |
NAV 106.66%
|
|
NAV 112.42%
|
Distribution 1.50%
|
|
Distribution 1.50%
|
Payments for the Euro and Dollar classes will be around July 22nd, 2026.
|
|
|
|
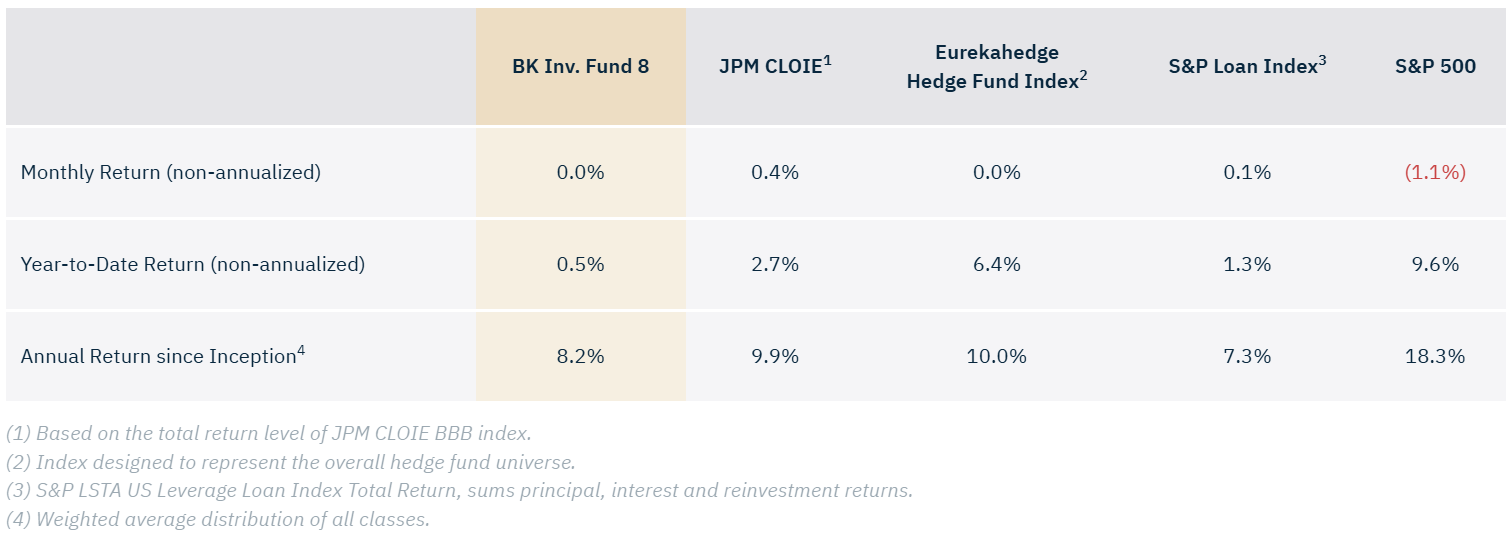
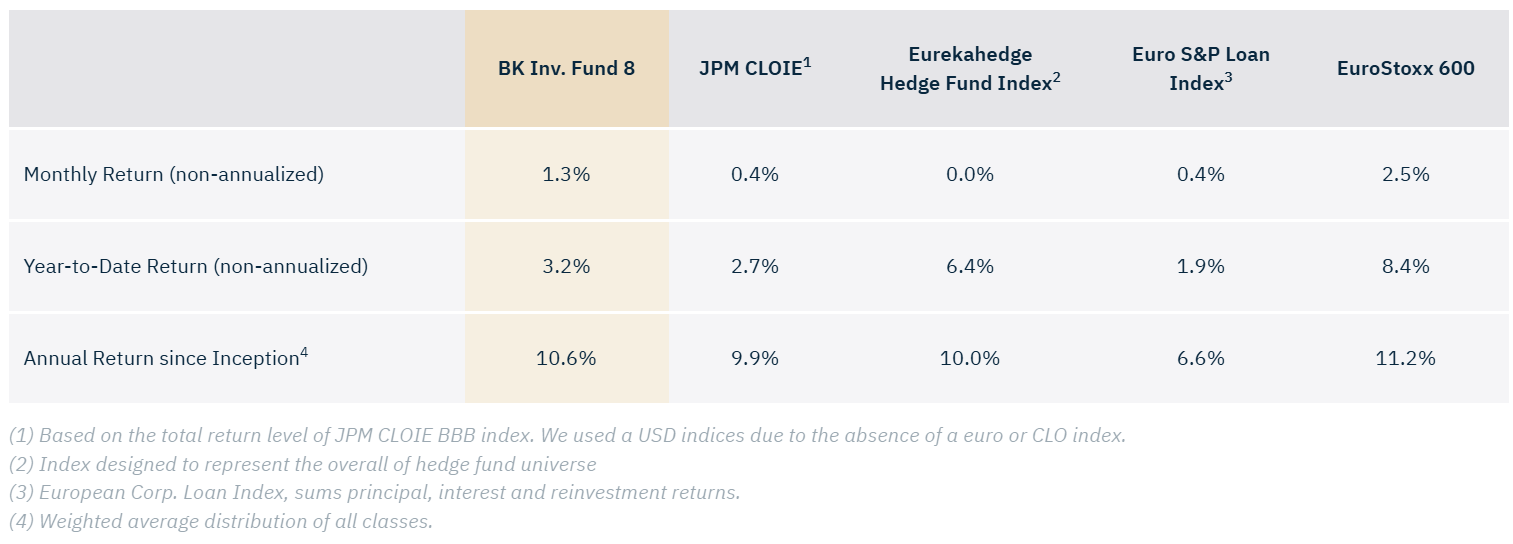
BK Opportunities Fund-8 final net performances
as of 30th June 2026
|
| Monthly1 |
0.0% |
|
Monthly1 |
1.3% |
| Year-to-Date1 |
0.5% |
|
Year-to-Date1 |
3.2% |
| Annual Return3 |
+8.2% |
|
Annual Return3 |
+10.6% |
|
|
|
|
|
17.5% |
|
|
+24.2% |
|
|
+29.9% |
|
|
3 - Weighted average distribution of all classes.
|
|
|
|
Fund and Market Performances as of 30th June 2026
|
USD
|
|
EUR
|
|
|
|
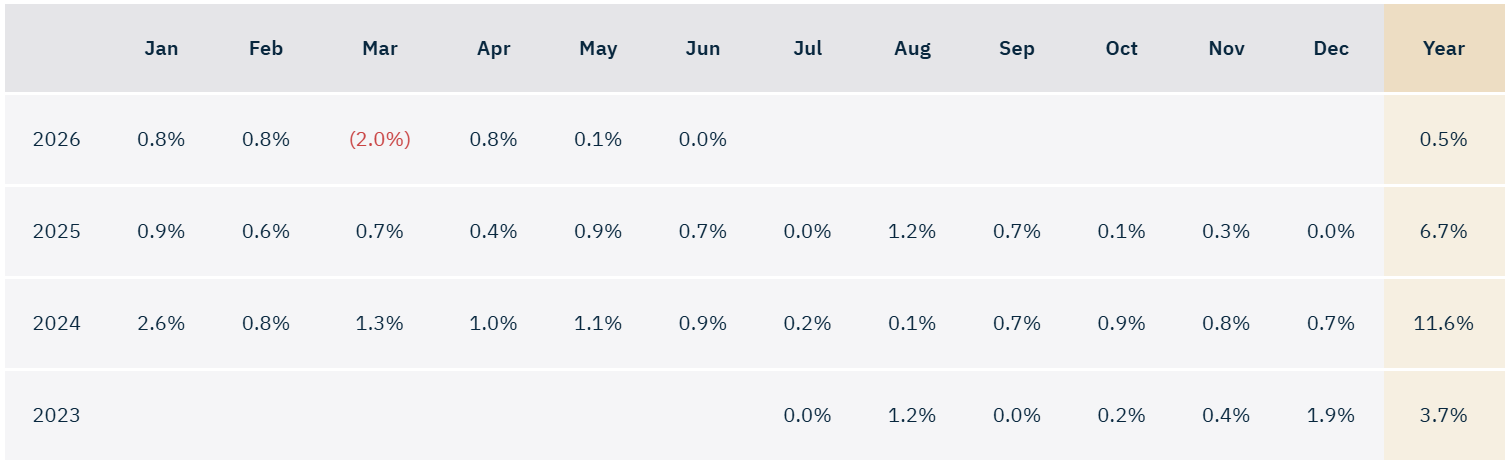
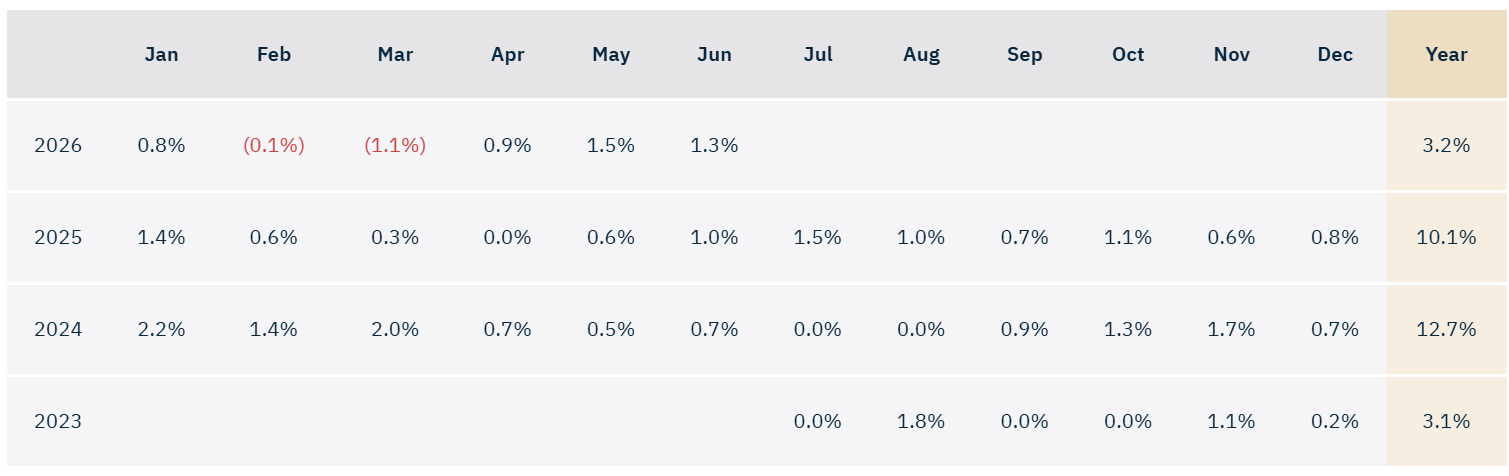
Monthly Performances
|
USD Performances
|
|
EUR Performances
|
|
|
|
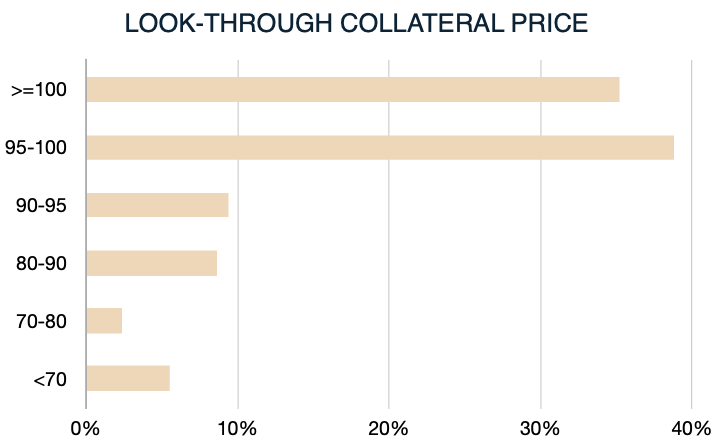
Look through Fund's Statistics
|
|
|
| Industry |
% of Portfolio |
| Healthcare & Pharmaceuticals |
10.7% |
| High Tech Industries |
9.6% |
| Services: Business |
9.3% |
| Banking, Finance, Insurance & Real Estate |
7.9% |
| Chemicals, Plastics & Rubber |
5.5% |
| Hotel & Leisure |
4.8% |
| Construction & Building |
4.5% |
| Beverage, Food & Tabaco |
3.9% |
| Telecommunications |
3.9% |
| Capital Equipment |
3.5% |
|
| Issuer |
% of Portfolio |
| Ineos |
1.3% |
| Liberty Global |
1.1% |
| Vmed O2 UK |
0.7% |
| 3I Group |
0.6% |
| Kantar Global |
0.5% |
| Altice NV |
0.4% |
| Quimper AB |
0.4% |
| Herens Midco |
0.4% |
| Pegasus Midco |
0.4% |
| Froneri Lux Topco |
0.4% |
|
|
|
|
|
|
Market Commentary & Portfolio Overview
|
|
The Middle East conflict reshaped the outlook on both sides of the Atlantic in Q2 2026, pushing oil toward $90/bbl, lifting inflation, and forcing central banks to pause or reverse easing. Europe saw growth decelerate and the ECB deliver its first hike since 2023; corporate earnings returned to growth but almost entirely on the energy windfall. The US proved more resilient — solid ~2% growth, double-digit S&P 500 earnings — but with stickier inflation that pushed the Fed to hold and drop its expected cuts. In credit, both leveraged loan and CLO markets stayed technically strong yet refinancing-led, rebounding sharply in May after a volatile spring. Across both regions, the market still needs M&A to return for genuine new supply.
|
|
|
|
|
|
|
The Economy: Monetary Divergence
|
|
The energy shock split the two economies. Europe's early-year momentum faded as growth slowed to a near-standstill (0.2% in Q1, subdued in Q2), prompting the ECB to deliver its first hike since 2023 — lifting the deposit rate to 2.25% to counter an energy shock it no longer saw as temporary. The US held up far better on AI-led investment and a resilient consumer, with growth near 2.0%, but paid for it with inflation: CPI jumped above 4% by May, forcing the Fed to hold off and cut its expected cuts. The result is two constrained central banks moving for opposite reasons — the ECB tightening in response to weakness, the Fed holding in response to strength.
|
|
|
|
|
|
Corporate Markets: Earnings Gap
|
|
Corporate results widened the gulf. US earnings were broad and strong, with the S&P 500 posting its sixth straight quarter of double-digit growth (~12–13% EPS, ~10% revenue), led by a ~45% surge in tech and the Magnificent 7. Europe's ~4% rebound looked healthy on the surface but was hollow: energy profits jumped ~25% while every other sector managed just ~1.5%. The war redistributed European profits rather than growing them, leaving a shallow, energy-dependent recovery in contrast to America's tech-driven one. Balance sheets stayed resilient on both sides.
|
|
|
|
Corporate Credit: Credit Under Strain
|
|
The credit backdrop was more alike than different, but exposures diverged. Europe kept tightening lending standards even as loan demand recovered, with defaults set to improve to ~2.4% by late 2026. The US market is deeper and far more exposed to private credit (~7% of corporate credit vs. Europe's ~1.5%), which left it more sensitive to the late-2025 stress headlines (First Brands, Tricolor). Yet US defaults are projected to fall sharply to approximately 3.0% as the maturity wall is refinanced away. The defining US theme is the fight between syndicated lenders and private credit for quality assets, which is driving looser covenants and hidden leverage.
|
|
|
|
Corporate Loans: Refinancing-Led
|
|
Leveraged loan issuance hit records on both sides in 2025 — over €235bn in Europe (a post-GFC high ex-2021) and heavy US volumes — but was overwhelmingly refinancing-led, leaving genuine new supply scarce as M&A stayed muted. Both markets are increasingly shaped by a "90/10" split: a healthy ~90% of borrowers trading near or above par, and a distressed ~10% dogged by liability-management exercises that creditors now flee at the first bad headline. Europe kept its spread premium to the US, but on both sides returns came from carry, not price rallies — and CLO demand is chasing a loan pool that isn't growing.
|
|
|
|
CLO Market: May Rebound
|
|
Both CLO markets moved in step: a volatile spring gave way to a strong May rebound, with refinancing and resets driving volumes as spreads tightened. Europe's market grew toward €300bn amid record warehouse creation, while the far larger US market saw a structural wave of resets as around $422bn in deals exited their non-call periods this year. Both share the same constraint — tight loan spreads squeeze equity arbitrage, and both need stronger new-loan supply to thrive. Underlying both is a deepening "90/10" split between a healthy majority of borrowers and a distressed minority, sharpening the gap between CLO managers.
|
|
|
|
|
|
|
BK Investment Grade Fund 8: Portfolio Overview
|
We have built a robust portfolio of BBB CLO tranches with USD (56%) and Euro (44%) positions. The portfolio is diversified by profile (the style of the CLO manager), vintage, and duration. We have participated in both new issues and the secondary markets, but have been more active in the latter over the year.
|
The priority has been on selecting our reinvestments given current market conditions and a spread-tightening environment; we receive both interest (from coupon payments) and principal (from transactions being restructured, more precisely, called resets). If a portion is kept for distribution, most of these proceeds are reinvested as we identify opportunities that fit our target return for BK Investment Grade-8. The objective is to maximise the expected returns while maintaining the same resistance levels. The portfolio is designed to benefit from a market softening but also resist more conservative scenarios. The fund distributes 1.5% for each USD and Euro class this quarter, bringing the total distribution to 17.5% since inception. Payments are being wired on or around 22 July 2026.
|
|
Since its inception, the USD portfolio has delivered 8.2% annually, and the Euro portfolio has delivered 10.6%, meeting our expectations. We believe the portfolio will continue to deliver strong performances as we maintain our trading discipline and strategy.
|
|
|
|
|
|
|
|
Fund’s Summary
|
| Currency |
USD and EUR |
| Fund’s Inception |
June 2023 |
| Distribution |
Quarterly |
| Investment Manager |
Oristan Ireland DAC |
| Administrator |
Apex Funds Services |
| Custodian |
CIBC Bank & Trust |
| Counsel |
Dillon Eustace |
| Auditor |
Deloitte |
| Bloomberg Page |
|
BKIG8AU KY <Eqty> (USD KY Feeder)
|
|
BKIG8AE KY <Eqty> (EUR KY Feeder)
|
|
BK8A1US LX <Eqty> (USD LX feeder)
|
|
BK8A1EU LX <Eqty> (EUR LX Feeder)
|
|
|
|
Portfolio Manager
Olivier Gozlan
|
|
|
|
|
|
|
|
|
|
This is not for distribution to, or use by, any person or entity in any jurisdiction where such distribution or use would be contrary to law or regulation. The information contained herein is for information only and does not constitute an offer regarding any product. The document has been prepared by Oristan Ireland DAC and the data have not been audited nor verified. Past performance cannot indicate future performance. There is no assurance that the investment objective will be achieved and investment results may vary.
|
|
|
|
|
|
|
|
|