|
|
|
|
BK Opportunities
Fund 6
Quarterly Report | 31st March 2025
|
|
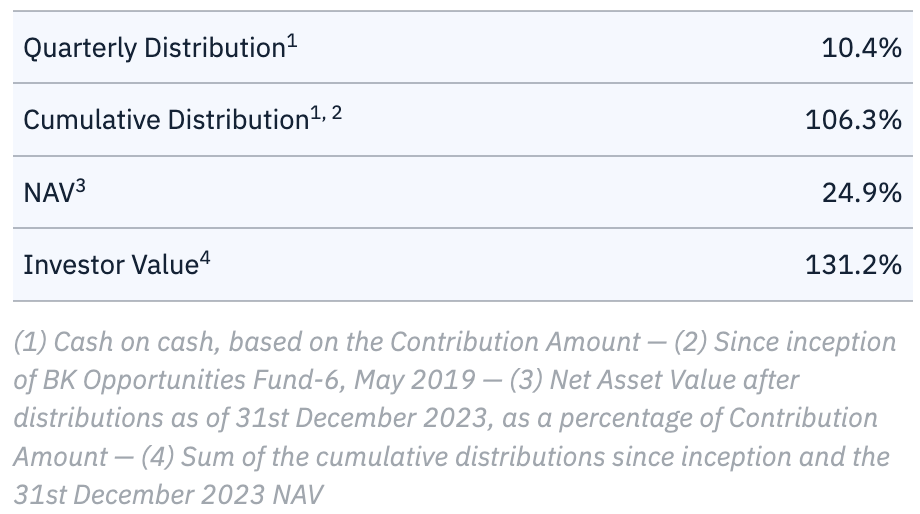
The final N.A.V. and distribution of BK Opportunities Fund-6 (USD) as of March 31, 2025 is:
|
NAV
|
24.93%
|
Distribution
|
10.40%
|
|
Payments will be wired on the 2nd of May, 2025.
|
|
BK Opportunities Fund-6 final net performances
as of 31st March 2025
|
| Monthly Return (non-annualized) |
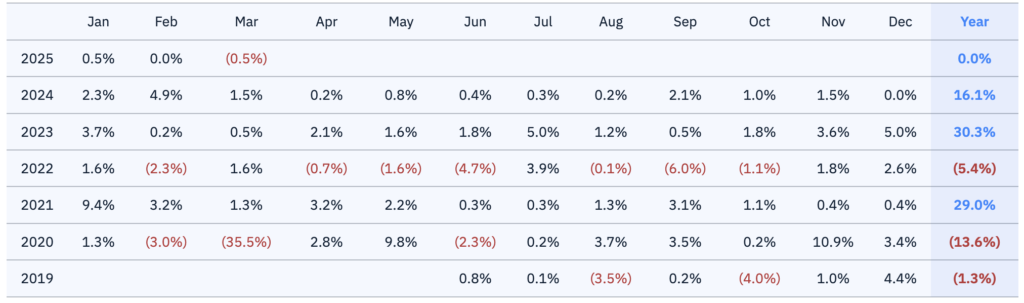
-0.5% |
| Year-to-Date (non-annualized) |
+0.0% |
| Annual Return since inception1 |
+6.9% |
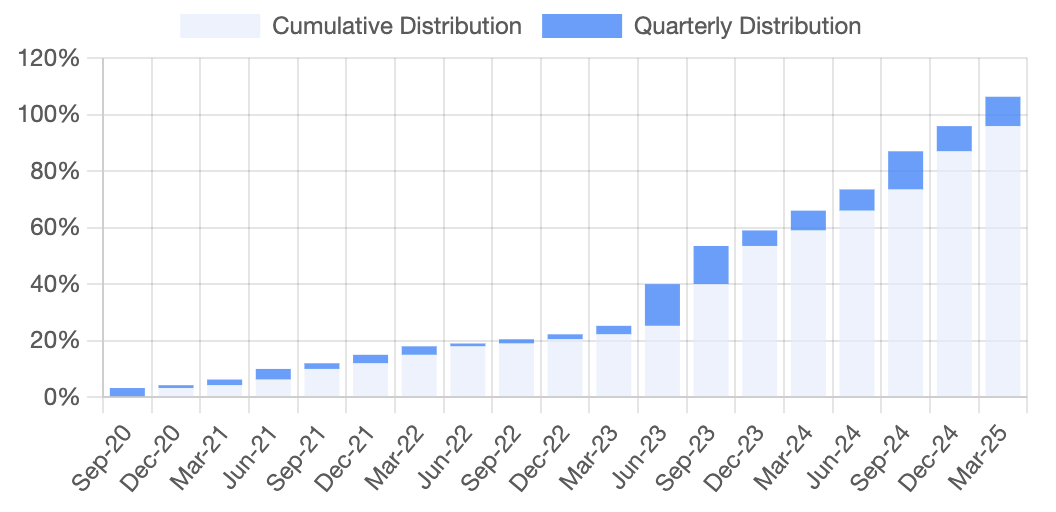
| Cumulative Distributions since inception/May 20192 |
+106.3% |
| Cumulative Return since inception/May 2019 (Distributions + NAV gain)3 |
+31.8% |
|
|
1 — Based on the weighted average internal rate of return (“IRR”) of all classes from their respective closing date at their respective entry price.
|
|
2 — Based on the number of shares (or the capital contribution) in the fund, i.e. assuming an entry price of $1,000 per share or 100.0%.
|
|
3 — Based on the weighted average cumulative return of all classes.
|
|
Market Commentary & Portfolio Overview
|
|
|
|
|
In Q1 2025, the U.S. economy remained resilient, but rising macroeconomic and credit market dynamics reshaped corporate fundamentals, loan pricing, and CLO.
|
|
|
|
|
|
The Economy: Macro Resilience Amid Uncertainty
|
|
The U.S. economy showed resilient growth in Q1 2025, with real GDP rising at an annualised rate of 2.5% despite heightened uncertainty from new trade tariffs and evolving fiscal policies. Inflation remained above the Fed’s 2% target, with CPI and core PCE inflation at 2.4% and 2.8%, respectively, while unemployment was around 4.2%. The Federal Reserve maintained a cautious stance, balancing inflation concerns with potential downside risks from geopolitical and trade tensions.
|
|
|
|
|
|
|
Corporate Markets: Mixed Landscape
|
|
Corporate America faced a mixed landscape in Q1, as earnings growth diverged by sector. While technology and energy companies continued to benefit from structural demand and pricing power, manufacturers and retailers felt the strain from rising input costs and softer consumer sentiment. Margins were compressed in sectors with high import dependency due to the newly implemented tariffs, and sentiment turned more conservative, reflecting uncertainty over trade policy and potential monetary tightening.
|
|
|
|
|
|
|
Corporate Loans: Repricing Risk
|
|
The corporate loan market remained active but showed early signs of risk repricing. Primary issuance volumes were stable, though investor appetite shifted towards higher-quality borrowers amid concerns about slowing earnings and tighter financial conditions. Loan spreads widened modestly, especially in the lower-rated segments, and covenant-lite structures remained prevalent, though new deals included slightly stronger protections in response to growing investor caution. Over the last 12 months, the default rate stayed subdued from the historical standard at 1.23%, even if we consider distress exchanged at 4.13%.
|
|
|
|
|
|
|
CLO Market: Active Market
|
|
The U.S. CLO market stayed resilient in Q1 but showed signs of recalibration. New issuance continued at a healthy pace, supported by strong demand from insurers and pension funds, yet AAA tranches saw a modest spread widening amid broader credit market volatility. Managers became more selective in loan purchases, emphasising sectors with stable cash flows, while warehousing activity cooled slightly due to pricing pressures. Secondary market liquidity remained decent, but signs of a more cautious investor base emerged as macro risks mounted.
|
|
|
|
BK Opp. Fund 6: Performances
|
|
The fund is now focusing on monetising its remaining positions, either via natural maturity, direct sale or restricting the position. We are aiming to be able to make final distributions in the coming quarters.
|
|
|
|
|
|
|
|
Fund and Market Performances as of 31st March 2025
|

|
|
(7) Based on the total return level of the JPMorgan CLO Index “CLOIE” for post-crisis CLO tranches rated BB (respectively B).
|
|
(8) This is the Institutional 200 index designed to represent the overall hedge fund universe.
|
|
(9) S&P LSTA US Leverage Loan Index Total Return, sums principal, interest and reinvestment returns
|
|
|
|
|
Monthly Performances
|
|
|
|
|
Cumulative and Quarterly Distribution
|
|
|
|
|
|
|
Top 10 Industry Exposure
| Industry |
% of Portfolio |
| Healthcare & Pharmaceuticals |
10.8% |
| Telecommunications |
9.3% |
| High Tech Industries |
8.9% |
| Services: Business |
8.2% |
| Media: Broadcasting & Subscription |
6.0% |
| Banking, Finance, Insurance & Real Estate |
5.9% |
| Hotel, Gaming & Leisure |
5.0% |
| Transportation |
4.6% |
| Construction & Building |
3.3% |
| Chemicals, Plastics, & Rubber |
3.2% |
|
Top 10 Issuers Exposure
| Issuer |
% of Portfolio |
| Asurion |
1.8% |
| American Airlines |
1.8% |
| Vmed O2 UK |
1.5% |
| Liberty Global |
1.2% |
| Telesat |
1.2% |
| Altice NV |
1.2% |
| Zayo |
1.0% |
| First Student |
1.0% |
| Avis Budget Group |
0.9% |
| First Eagle |
0.8% |
|
|
|
|
|
|
Fund’s Summary
|
| Currency |
USD |
| Fund’s Inception |
May 2019 |
| Last Closing |
February 2020 |
| End of Reinvestment Period |
February 2023 |
| Maturity5 |
February 2025 |
| Distribution |
Quarterly6 |
| Investment Manager |
Oristan Ireland DAC |
| Administrator |
Apex Funds Services |
| Custodian |
CIBC Bank & Trust |
| Banker |
Northern Trust |
| Counsel |
Dillon Eustace |
| Auditor |
Deloitte |
| Bloomberg Page |
|
|
|
(5) Excluding the possible 2‐year extension
|
|
(6) First quarterly distribution made on 30th September 2020
|
|
|
|
Portfolio Manager
Olivier Gozlan
|
|
|
|
|

|
|
|
|
|
This is not for distribution to, or use by, any person or entity in any jurisdiction where such distribution or use would be contrary to law or regulation. The information contained herein is for information only and does not constitute an offer regarding any product. The document has been prepared by Oristan Ireland DAC and the data have not been audited nor verified. Past performance cannot indicate future performance. There is no assurance that the investment objective will be achieved and investment results may vary.
|
|
|
|
|
|
|
|
|